Posts tonen met het label tutorial. Alle posts tonen

vrijdag 9 mei 2014

MAD about MAT! The 'simple' tutorial!

What’s MAT (Eclipse Memory Analyzer)

It help reads your java heap dumps and helps you connects the dots. Mat is an a great a heap dump analyzer, developed by Eclipse/IBM & SAP.
It's supported for the SUN jvm and the IBM jvm.


MAT ( Eclipse Memory Analyzer)


Is it easy?

Well to be honest, No! You can write a book about the jvm and how to fix memory problems. I hoping after you finished reading this you can find the big problems easy. The harder problems you probably will find after reading some more tutorials and getting some experience under your belt.

Download

MAT is free! So Please download and try it out yourself.
http://www.eclipse.org/mat/downloads.php
TIP: Download it Now while you read. What do you have to lose a few MB?

How to use?

I have searched the Internet, finding many different tutorials. Instead of writing my own, I have found the best way of working was thanks to the advice of Vatel

Hello Markus, ⇐ owner of an excellent performance blog.

I would like to share my own experience of using MAT.
MAT is really a great tool, but your should known well how to use it! Unfortunately, by default MAT shows some useless windows, so you may be disappointed.

OK, below is my "How to", it would be great to compose a tutorial based on it and include it into MAT docs. I included screenshot of my example "my.leaks" application

===============================================

How to use Eclipse MAT to analyze memory dumps.

===============================================

Initial steps:

- if working with large heap dumps (> 1 Gb), it is recommended to increase Xmx value in eclipse.ini (ex. -Xmx2400m)
- open your dump (File -> Open heap dump), wait until parsing is finished
- for a fast preview, make a summary histogram (button "Create a histogram from an arbitrary set of object" on the toolbar),
sort by retaind heap, look at object types which retain most of memory (usually, String/char[] and byte[])


1. The first way - using dominator tree grouped by packets/classes

1.1  The DOMINATOR tree (author's remark: I love this word!)

Press button "Open query browser", in the drop-down menu select "Java Basics -> Open in dominator tree",
type a filter for your classes in "objects" field, ex. "com.yourcompany.yourproject.*",
in the "groupby" field, select "by package", look at the results (retained heap), expand your packets and subpackets,
see how much memory is retained by each packet/subpacket.
This way you may understand which module(s) of your system consume most of memory.

In my example this "my.leaks.*"

Screen MAT ( Eclipse Memory Analyzer)


Selecting the dominator tree


Java Basics / Open In Dominator Tree

1.2 Show retained set

Select a packet (or a class) you want to investigate (which retains much memory),
in the drop-down menu select "Show retained set",
look at object types which consume most of memory (in the context of the selected package),
you should sort the results by retained heap.
So, you see which types of objects are consumed by some of your modules/subsystems.

Dominator tree by package
Show retained set


1.3 Show largest objects

Click on some object type (usually, you look at char[] and byte[]),
in the context menu select "List objects -> with incoming references", sort the results by retained heap.
This way, you will see largest objects of the selected type. You may see their contents, copy them into clipboard
or a file ("Copy" in the context menu)
To see more objects, click on the "Total" line (in the bottom) and select "Next" in the context menu.

MAT - List Object with incoming refrence


1.4 Analyse

Select an object instance from the result, look at its contents, and also expand incoming references,
analyze why this object is referenced and why this value is here (this depends on your business logic).
It makes sense to look at more objects from the result and analyze them.


1.5 Repeat

Repeat steps for different object types and also different packets and/or classes
(you are interested in objects which retain most of heap).


2. Another way (Using the histogram)

2.1 Histogram

On the summary histogram (see Initial Steps above) select a type (class) which retains much memory (ususally char[]/String, byte[])

Menu MAT - Select Histogram


2.2 incoming references

In the context menu select "Show object by class -> by incoming references"
Histogram MAT - Selecting incoming refrences


2.3 Expand the resulting tree

look - which class references to it, then look which class references to that class, etc.


2.4 Retained Set

At each step you may look at the retained set of any class ("Show retained set" in the context menu)
or at the concrete object instances ("List objects -> with incoming references" in the context menu).

Resource: http://kohlerm.blogspot.com/2009/07/eclipse-memory-analyzer-10-useful.html
The end

My personal favorite/alternative

Instead of selecting List Objects, choose Select Show Objects By Class ->  by incoming references"

And expand:

Show Objects By Class ->  by incoming references


The answer: Here our service CreateLeaks is creating a leak(what's in a name).

Extra information

Wait, wait, what did he say?
You can some great reference information at:

short version:

http://yourkit.com/docs/95/help/sizes.jsp

some what longer version:

http://kohlerm.blogspot.com/2009/02/how-to-really-measure-memory-usage-of.html

Some good slides: last view slide give you some usefull advice. Like how to dump in your jvm(IBM and SUN)
http://www.slideshare.net/AJohnson1/extending-eclipse-memory-analyzer

So why am I MAD about MAT/Conclusion

MAT is an excellent, and you will find lots of great tutorials. Who will explain to you a lot. I mean really a lot! (Time consuming) Personal advice follow the wise words of Vatel and try and not to loose too much time. If you want to know more... just read http://java.dzone.com/news/how-fix-memory-leaks-java

maandag 14 november 2011

Performance Architecture Checklist

This checklist can be used to help you in your design for a scalable application. The idea is, you take performance into consideration while you are designing your architecture, not after done.


You will need to think carefully, which matters apply to you and how you will have to implement them.
This is not a silver bullet, but a mental exercise.

Deployment and Infrastructure

  • Use distributed architectures appropriately. Do not introduce distribution unnecessarily! 
  • Carefully select appropriate distributed communication mechanisms. 
  • Locate components that interact frequently within the same boundary or as close to each other as possible. 
  • Take infrastructure restrictions into account in your design 
  • Consider network bandwidth restriction 
  • Identify resource restrictions. 
  • Ensure your design does not prevent you from scaling up. 
  • Ensure your design does not prevent you from scaling out and it uses logical layers, does not unwittingly introduce affinity, and support load balancing!

Coupling and Cohesion

  • Ensure your design is loosely coupled.
  • Exhibit appropriate degrees of cohesion in your design and group together logically related entities, such as classes and methods.

Communication
  • Interface do not enforce chatty communication.
  • Ensure your application only makes remote calls where necessary. Impact is minimized by client-side validation, client-side caching, and batching of work.
  • Optimize remote data exchange.
  • Choose appropriate secure communications mechanisms.
  • Use message queues to decouple component parts of your system.
  • Mitigate the impact of long-running calls by using message queues, “fire-and-forget” approaches, and asynchronous method calls.

Concurrency

  • Watch out which types you use. Many basic types have locking behaviour. Example HashMap, instead when in doubt, use Concurrent(HashMap).
  • Carefully consider lock granularity. Synchronised(writes > reads) or locks (reads > writes).
  • Ensure your application acquires shared resources and locks late and releases them early to reduce contention.
  • Choose an appropriate transaction isolation level.
  • Ensure your application uses asynchronous execution for I/O bound tasks and not for CPU bound tasks.

Resource Management

  • Ensure your design supports and makes effective use of pooling.
  • Ensure your application acquires resources late and releases them early.

Caching

  • Use caching for data that is expensive to retrieve, compute, and render.
  • Cache appropriate data such as relatively static Web pages, specific items of output data, stored procedures parameters, and query results.
  • Do not use caching for data that is too volatile.
  • Select an appropriate cache location.
  • Select an appropriate cache expiration policy.

State management

  • Your design favors stateless components. Or, you considered the negative impact of scalability if you decided to use stateful components.
  • If you use Web services, you also use a message-based stateless programming model.
  • Make objects you want to store serializable.
  • Consider performance impact of what you put in your session.
  • Use statistics to help you, get your thread pool and sessions duration wright.

Data structures and Algorithms

  • Ensure your design uses appropriate data structures.
  • Use custom collections only where absolutely necessary.

Data Access

  • Pass data across the layers by using the most appropriate data format. Carefully consider the performance implications.
  • Use stored procedures for complex data access.
  • As rule: Don’t use loops, when accessing data with your ORM(example hibernate).
  • Only process the data that is required. (Less is more)
  • Where appropriate, provide data paging solution for large result sets.

Exception Handling

  • Do not use exceptions to control regular application flow.
  • example: if you control a Single Sign On system, when the user mistypes his password. This is a normal flow!
  • Structured exception handling is the preferred error handling mechanism. Do not rely on error codes.
  • Only catch exceptions for a specific reason and when it is required.

Monitoring

  • Implement monitoring in your application, that can be turned on and off. When turned of this should have zero impact.
  • Implement Application Monitoring. Showing you where time is being spend in your application
  • Implement User Performance Monitoring. This will let your see where the user is spending his time.
  • Allow tracing over multiple tiers.
  • Automatically monitor slow request.
  • Implement sampling of your data. This will lower the impact when you need to monitor your application.
  • Use the statistics for your monitoring, when you are thinking of making adjustments to your architecture.

Common Sense

Use it!

This checklist originated/(largely based) from the Microsoft best practices. Please continue reading there. It’s a very good site with lots of help full tips, while being only slightly outdated. This show that performance is not technology specific.

woensdag 9 november 2011

Performance Requirements?


Design for performance: Requirements

Before designing an architecture, we should know what we want. Our goal here is to include performance as part of the solution, not part of the problem.

The real problem for me in completing this document with my customer, is the customer didn’t think of response times while trying to solve his problems. That’s why I suggest always giving the user a couple of choices. Ask them what feels right, what feels acceptable? Not, want they want, because most of the time, they don’t know or it isn’t realistic. I will discuss this subject (Performance Psychology) later on, in on of my next blogs.

General


  • Response time(ms): It’s common to here to make a difference between writes and reads operations(get/post).
    • Average(ms): What do you expect?
    • Maximum response time(ms): What is acceptable?

Note: I normally split this up in, maximum time under normal circumstances and while the system is under heavy load.
  • Throughput(hourly of minutes): maximum amount of requests your system should be able to handle. Think of spikes.
  • Concurrent Users: How many users will be using the system at the same time.

User type

Depending on the type of user using the system, these will vary enormously.
Interactive(Human)? Is a person using the system?
Synchronous  or As-synchronous: The “micro”second the user can continue working, is the time you should measure.
Batch/Scheduled(Machine)? Is an application using your application? Define your time window and don’t forget, you are not alone! Other batch jobs of application can be running at the same time.

Scope


Define these previous requirements for the entire application and for specific business cases.

Application requirements

The application requirements are good defaults. These requirements will also help you decide what kind of hardware you will need.

Business requirements

Performing Business logic is key, so performance should play a part in here as well.

Eligible Business cases:
  • Frequently used scenarios
  • Performance-intensive scenarios
  • Business-critical scenarios
  • Scenarios of special interest


For business cases add the following requirement:

Task driven (Usability/Performance)

Task completion: How much time would the person need to accomplish the task?
Task feedback loop: How fast can we give the user feedback about his task?
This may not sound like a performance criteria, but here you can gain the most time. By smart interface design, you can solve problems faster(performance) and better.

Technical

Resource cost: CPU, file access, network, data access....
You will have limitations, either from your own system(hardware), or an other systems you are working with.
Volatile data: Decide how volatile the data(ready to change) is. 

  • Very Volatile(data changes often): Make the data you need as small as possible. 
  • Not Volatile(data doesn't change often): Caching maybe? It’s not a must, but think about it.

Most data lays somewhere in between, so always be careful, how much data you need(less is more).

Scalable: This is closely related to the resource cost. You should watch out for bottlenecks here. Ask yourself the question: In case my application grows, where will it have the most impact? Can we handle this additional load, or can we scale it(example: more hardware)? This question will be handled in my next blog post. (Scalable Architecture)

Would you like to know more:


http://www.testingreflections.com/node/view/4432

http://publib.boulder.ibm.com/infocenter/pseries/v5r3/index.jsp?topic=/com.ibm.aix.prftungd/doc/prftungd/doc_perf_reqs.htm
http://www.perftestplus.com/resources/requirements_with_compuware.pdf


Remember: Performance is a part of solving the problem, it doesn’t stand alone!

These are my two cents. In case you have something to add, or even better, something to take away(perfect design). Do tell!  

vrijdag 4 november 2011

Start towards Perfomance

Patience is a virtue, but I can’t wait to get my job done. My friend said to me:"Fast, Good, Cheap, pick any 2". Where I replied: How Fast are we talking about?

In Top Gear, people are always talking about the feelings you get when see a car. When you drive it. The feeling of speed is one that stands out for me. Why? A car is made too bring you from point A to point B, as fast possible and as comfortable as possible and now also as cheap as possible. A business website has similar goals, they want the customer to find they way through their site and in too their bank account.

Design for performance is more than tuning, it’s providing a highway from point A to point B, in a tuned up the luxe sport car, where you can feel the wind through your hair. Good usability and good performance should go hand in hand.

This is not done over night, building an application that can handle speed and success takes time and proper testing, so don’t crash when you shave a corner. Structured Load and Stress testing reduces risk of this happening.

There is an other way... What if there were no traffic jam’s, ever? Wouldn’t that safe you more time than a pimped up super car? I know what you are thinking, I would rather have the pimped up super car. But for just a minute, be honest with yourself. If you never had traffic jams, wouldn’t you be happier? Just a little? Think of time you’ll safe. For cars this sounds like science fiction, but for applications it can work. Welcome in the world of Application Performance Management. Here we can intervene proactive, so no accidents in production.

So please join me in this series of blogs, discovering ways how performance improves your day to day job and how easily to accomplish it. Feedback is welcome. I will try to answer your questions to the best of my abilities, when I talk about that subject.


As a personal challenge, I will be updating this blog weekly. Until I get tired of it or I find something more interesting.

donderdag 14 juli 2011

Know where to look for bottlenecks! Business Transaction!

Time is of the essence when facing performance problems. We need to find out what's going on and who is effected by it.
If you have a distributed environment with clusters, multiple tiers, loadbalacing... Things can become a bit tricky in finding the root cause.
You will need to monitor everything that could be a potential bottleneck:

  • Memory
  • CPU
  • IO
  • Network
  • Application(s)!
Copyright AppDynamics


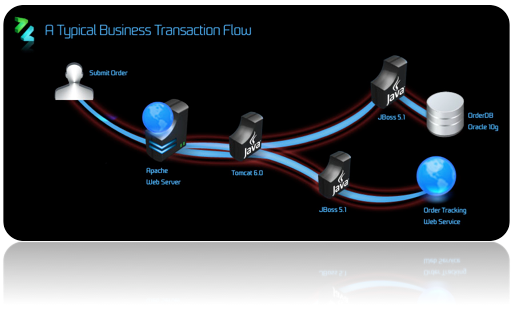
A business transaction is a way that helps you visualize one or more 'user interactions' in a certain theme.

 Example of business transactions:
  • Show detail
  • Checkout
  • Find product

 These 'user interactions' can run over one or multiple application transaction(s) which on their turn can be spread over one or our multiple nodes/tiers. The goal is to simplify and clarify. By doing this we can more easily estimate the impact of the problem and triangulate the problem faster. We are no longer looking at individual graphs of multiple machines but one business transaction that can run across multiple machines!
This small list of business transactions looks simple enough:


But when we have a closer look on what's happening, we can see how skillfully it hides it complexity.


The trick in defining business transactions is to make it 'user centric' => simple.
If your Dev, Ops, Business and/or a normal person. You can understand the importance if your checkout transaction is going slow, it's costing money!
So how do we create business transactions?
We are again using AppDynamics to help us show how it's done.

Dynamic discovery find our transactions automatically in most web applications. For Non-web-application, you can simply choose to listen to a class, interface or method.

We can add one our more simple rules to help us find our transactions. You can also simply choose to listen to a class, interface or method. (not visible on the screenshot)


In case we want to know more, for example we want to check our special sales offers or even more important COLOR. We can do this as well!


Step 1

Step 2


Or we want more details, AppDynamics can help us even more. We can even use the payload. (Think REST/web-services!)


That's all for now. Next time, we will start looking in how to find/resolve blind spots. If you like to know more about business transaction click on the link.