donderdag 14 juli 2011

Know where to look for bottlenecks! Business Transaction!

Time is of the essence when facing performance problems. We need to find out what's going on and who is effected by it.
If you have a distributed environment with clusters, multiple tiers, loadbalacing... Things can become a bit tricky in finding the root cause.
You will need to monitor everything that could be a potential bottleneck:

  • Memory
  • CPU
  • IO
  • Network
  • Application(s)!
Copyright AppDynamics


A business transaction is a way that helps you visualize one or more 'user interactions' in a certain theme.

 Example of business transactions:
  • Show detail
  • Checkout
  • Find product

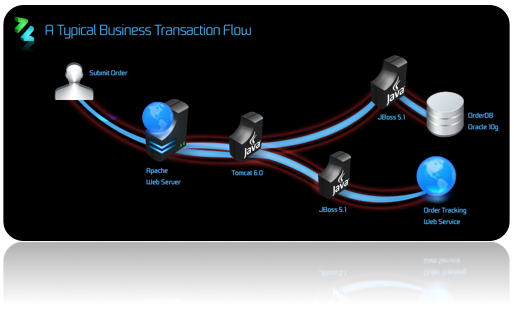
 These 'user interactions' can run over one or multiple application transaction(s) which on their turn can be spread over one or our multiple nodes/tiers. The goal is to simplify and clarify. By doing this we can more easily estimate the impact of the problem and triangulate the problem faster. We are no longer looking at individual graphs of multiple machines but one business transaction that can run across multiple machines!
This small list of business transactions looks simple enough:


But when we have a closer look on what's happening, we can see how skillfully it hides it complexity.


The trick in defining business transactions is to make it 'user centric' => simple.
If your Dev, Ops, Business and/or a normal person. You can understand the importance if your checkout transaction is going slow, it's costing money!
So how do we create business transactions?
We are again using AppDynamics to help us show how it's done.

Dynamic discovery find our transactions automatically in most web applications. For Non-web-application, you can simply choose to listen to a class, interface or method.

We can add one our more simple rules to help us find our transactions. You can also simply choose to listen to a class, interface or method. (not visible on the screenshot)


In case we want to know more, for example we want to check our special sales offers or even more important COLOR. We can do this as well!


Step 1

Step 2


Or we want more details, AppDynamics can help us even more. We can even use the payload. (Think REST/web-services!)


That's all for now. Next time, we will start looking in how to find/resolve blind spots. If you like to know more about business transaction click on the link.

donderdag 7 juli 2011

Finding the root cause! Fast! With AppDynamics!


The thing I love most about Java are the awesome tools! The plugins for IDE's, the profilers (ex. YourKit) , the memory analyzers (ex. eclipse MAT), the javaagents (ex. JRebel)... But my absolute favorite of all  are the APM-tools(Application Performance Management). This really helps me in my day to day life.

In this series of tutorials we will cover a lot of functionality what a great APM-tool can do for you. I will be using my favorite APM on the market AppDynamics.
Why? It looks awesome and it does the job well. I can use in production without me becoming the bottleneck (< 2% overhead)!

Tutorial number one:
Finding the root cause! Fast!

Step 1: The application dashboard!

1: Here we are on our dashboard. We see our different tiers and nodes of our application.
2: There seems to be a problem with our response times. Better look into it!
3: Here we see the snapshots taken of the incident.

Step 2: A closer look
We have a lot snapshots of slow transactions. No stalls yet! Click on the camera...SMILE.


Step 3: Snapshot list
We see a list of all snapshots taken. We select a snapshot too see what's happening.


Step 4: Insight in the transaction
Node 2 tier 1 seems to be having some difficulty. We better drill down to find out what's going on.

Step 5: Drill Down


Root cause found: A Thread.sleep. It was only a test. Glad no one ever uses Thread.sleep in production...

Things you should know:
AppDynamics takes snapshots automatically when transactions are running slow.
So you don't have to worry about watching your application all of the time.
How does AppDynamics know my transaction is running slow?
Self learning baselines. Meaning you don't have to configure a thing to detect abnormal deviations. Also it becomes more accurate over time!
P.S.  In case you do not agree with the defaults, you can always configure them manually.
*Lite version(FREE): You will have to start a diagnostics session manually to take snapshots. (right click on the transaction => start diagnostic session).

That's all for today.

Next tutorial we'll talk about Business Transactions.
What are they and how can they help us?
How to define them or NOT! (auto-discovery)

Please look forward to my next blog and please give feedback!